
Utility Detection & Mapping
Choose the utility workflow around the job
From straightforward service avoidance and immediate mark-out to professional multi-frequency mapping, UTSI provides different GPR workflows for different operators, sites and survey deliverables.
Select by Field Outcome
Three utility workflows for different users and deliverables
Start with the decision the operator must make in the field, then select the system that provides the appropriate level of guidance, radar information and configuration.
Straightforward service avoidance
e-Safe
A practical pre-excavation workflow that presents processed likelihood information rather than requiring the operator to interpret a conventional radargram.
- Designed for service-avoidance tasks
- LOG single-line and PRO multi-line workflows
- Clearer operation for non-specialist GPR users
- Supports traceable field records
Immediate mark-out and utility mapping
e-Spade Lite
A folding, field-portable GPR system for operators who require visible radar information, immediate mark-out and conventional utility-mapping capability.
- Immediate Mark Out workflow
- Utility Mapping workflow
- XPM2 and UP400 antenna configurations
- Folding format for transport and storage
Configurable professional GPR
GroundVue
Professional systems for experienced operators who require direct access to radar data, multiple frequencies, configurable channels and specialist survey arrangements.
- TriVue simultaneous 250, 500 and 1000 MHz collection
- GV3 modular one to eight-channel configurations
- Professional positioning and data workflows
- Custom carts, frames and antenna arrangements
Why Use GPR
GPR adds a different source of subsurface information
Across simplified avoidance, immediate mark-out and professional mapping workflows, GPR can complement electromagnetic locating, records and other survey evidence.
Use GPR alongside electromagnetic locating
GPR is not normally used as a standalone clearance method. Instead, it complements electromagnetic locating, records and other survey techniques by providing a different form of subsurface information.
Investigate non-conductive services
Plastic pipes, drainage, fibre-optic routes and other non-conductive targets may not respond to conventional electromagnetic locating but can produce a radar response.
Collect continuous survey information
Radar data can be collected continuously along a survey line, supporting the identification of utility routes, crossings and other changes beneath the surface.
Match the system to the required survey
Antenna frequency, channel count, positioning method, data density and reporting requirements should be selected around the site and expected targets.
Professional Utility Mapping · Antenna Frequency
One frequency may not detect every utility
Antenna frequency affects target definition and penetration. A mid-range antenna can provide useful general utility information, while a higher-frequency antenna can improve the definition of smaller and shallower targets.
Mid-range frequency
Commonly used for general utility investigation where a balance between depth and target definition is required.
Higher frequency
Shorter wavelengths can improve the visibility of smaller, closely spaced or shallow targets, including telecommunications and fibre-optic routes.
Multi-frequency survey
Combining frequency ranges provides a broader view of the subsurface than relying on one antenna alone.
Professional Utility Mapping · System Configuration
Select single or multi-channel collection around the site
The appropriate configuration depends on the survey area, expected utilities, available access and the required collection speed.
Flexible Entry Configuration
Single channel
A single-channel system allows one antenna to be used at a time, with antennas changed when another frequency is required.
- Lower system complexity
- Suitable for targeted survey work
- Antennas can be changed between survey passes
- Useful where access or space is limited
Professional Utility Mapping
Multi-channel
Multiple antennas can collect different frequency ranges or cover a wider area during the same survey pass.
- Simultaneous data collection
- Multiple frequency combinations
- Increased survey coverage
- Configurable antenna spacing
Large-Area Survey
Array configuration
Wider multi-channel configurations can increase coverage and data density for large-area utility investigation.
- Greater survey width
- Higher collection productivity
- Dense survey-line spacing
- Application-specific frame design
Survey Accuracy
Accurate results require accurate positioning and calibration
Radar records travel time very precisely, but reliable utility position and depth information depends on the wider survey method.
Horizontal position
GPS, total-station information, survey reference lines or a distance encoder can be used to record where the radar data was collected.
Transmission velocity
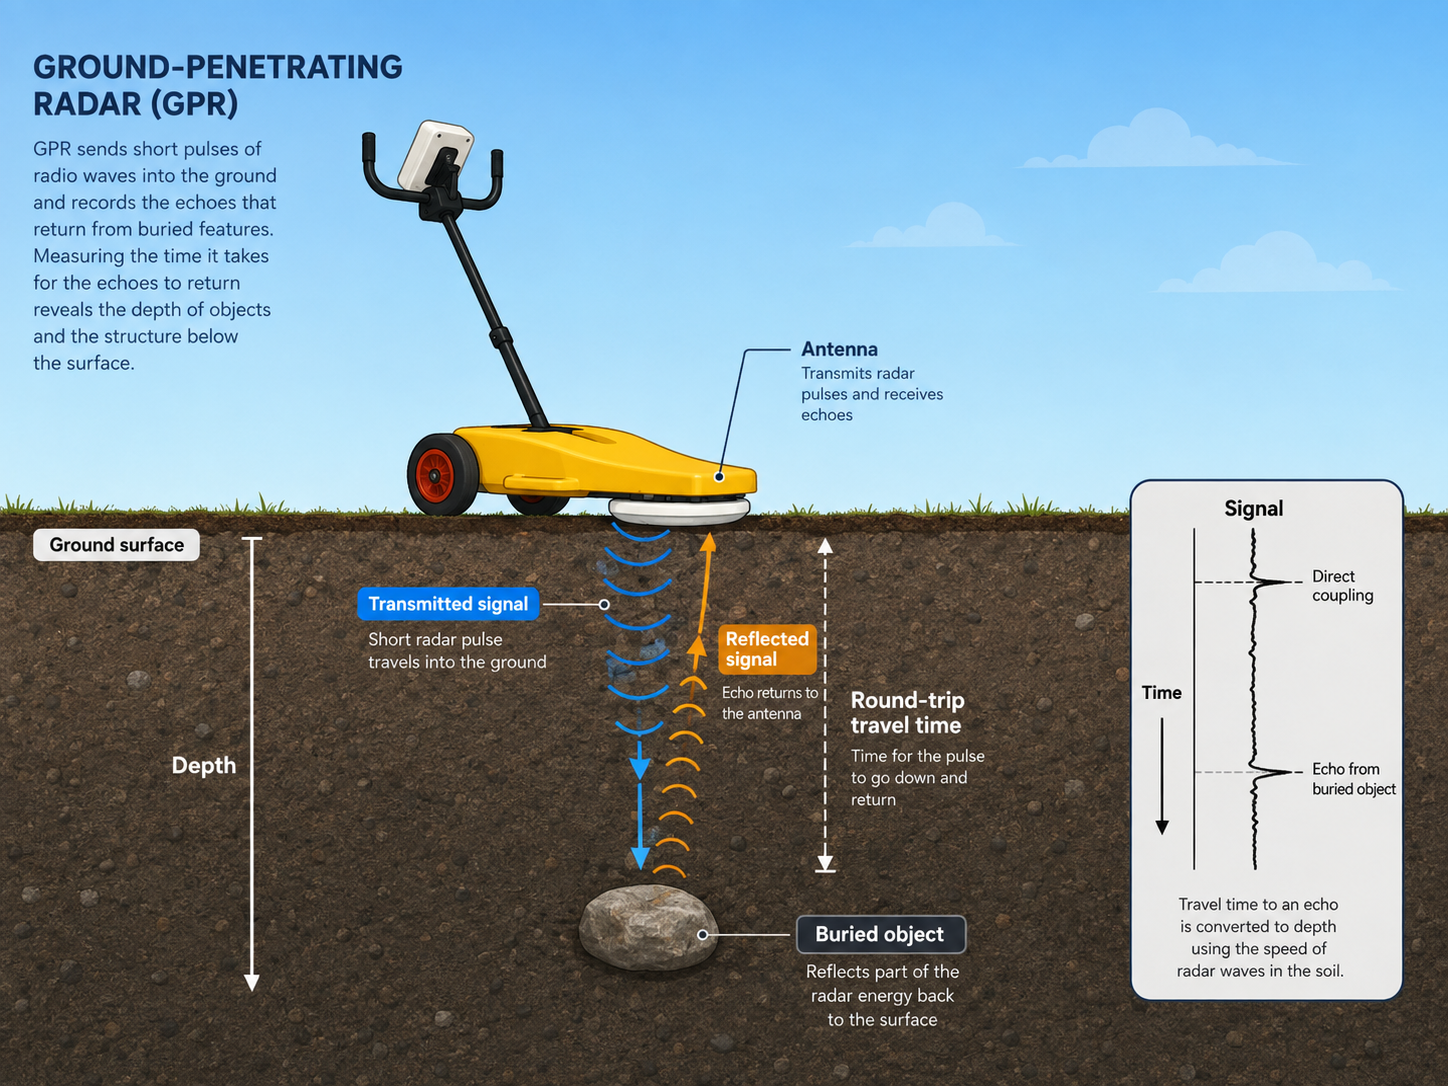
Radar records reflection time. Converting that time into depth requires an appropriate estimate or measurement of wave velocity through the surveyed material.
Site calibration
Velocity varies between sites and with material and moisture conditions. Site-specific calibration improves depth estimates.
Resolution limits
Target separation and minimum detectable size are influenced by wavelength, frequency, target geometry and surrounding conditions.
Equipment Deployment
Adapt the collection method to the survey surface
Utility detection is commonly completed using a trolley, but different deployment methods can be considered for large areas, rough ground and restricted access.
Trolley mounted
A push-along trolley is suitable for many roads, pavements, yards and construction sites and supports controlled survey-line collection.
Vehicle mounted
Vehicle or trailer mounting may be considered where larger areas must be covered efficiently and the survey environment allows higher collection speeds.
Hand-towed or specialist frame
Hand-towed antennas and adapted frames can support survey work over rough surfaces, embankments or areas where a standard trolley is unsuitable.
Fibre-Optic Detection
Fibre-optic routes are not automatically invisible to GPR
GPR does not detect the electrical signal inside a cable. It responds to changes in material properties and target geometry. A suitable high-frequency antenna can improve the possibility of imaging smaller and shallower fibre-optic installations.
Survey Limitations
When results are poor, identify the technical reason
GPR performance depends on the equipment settings, site materials, moisture, target size and the relationship between wavelength and the expected utilities.
Conductive ground
Salt water and some wet clays can absorb radar energy, reducing the amount of signal returned to the receiver and limiting useful investigation depth.
Incorrect depth window
Data beyond the selected recording window cannot be recovered later. The collection settings must allow sufficient travel time for the expected target depth.
Moisture and rainfall
Groundwater and recent rainfall can alter transmission velocity and effective penetration, affecting both depth interpretation and survey settings.
Unsuitable frequency
A wavelength that is too long may not resolve small or closely spaced targets. A very high frequency may improve resolution but reduce achievable depth.
Survey Workflow
Plan the survey around the required deliverable
Establish the required survey standard, target types, positioning accuracy and reporting output before data collection begins.
Define the requirement
Confirm the area, expected services, target depth, required survey standard and final deliverable.
Select the configuration
Choose the antenna frequencies, channel count, positioning method and deployment arrangement.
Collect and review
Survey in suitable orientations, monitor data quality and adjust settings where site conditions require it.
Interpret and verify
Combine the radar results with EML, records, site evidence and appropriate physical verification.
Important Safety Information
A GPR survey does not provide excavation clearance
Utility detection results should be used as part of a wider safe-dig and survey process that includes appropriate records, electromagnetic locating, competent interpretation, visual inspection, physical verification and applicable industry guidance.
Frequently Asked Questions
Common utility-detection questions
Contact UTSI for system-selection guidance based on the site, target utilities and required survey output.
Does GPR replace electromagnetic locating?
Can GPR detect plastic pipes?
Which antenna frequency should be used?
Can GPR detect fibre-optic cables?
How is utility depth calculated?
Why might GPR perform poorly on a site?
Choose the Right Utility Workflow
Start with the field outcome, not only the antenna frequency
Select a straightforward avoidance workflow, immediate mark-out and utility mapping, or a configurable professional GPR system according to the operator, site and required deliverable.